You have no items in your shopping cart.
Step 1: Familiarizing with Key Concepts in Photometric Reports
Understanding photometric reports begins with a grasp of several fundamental concepts, each playing a vital role in how we perceive and utilize light in various settings. This foundational knowledge is crucial for interpreting the more detailed aspects of the report accurately and effectively.
Luminous Flux (Lumens)
At the core of lighting design is luminous flux, measured in lumens. This term quantifies the total visible light emitted by a source, essentially telling us how bright the fixture is. In practical terms, comparing the lumens against the requirements of your space helps determine if a light source is sufficient and appropriate. For instance, a softly lit living room and a brightly illuminated office space will have vastly different lumen requirements.
Illuminance (Foot-Candles or Lux)
Illuminance, measured in foot-candles or lux, is about how much of that light lands on a surface. This measurement is key to ensuring that specific areas of a project receive adequate light for the tasks at hand. The illuminance levels required can vary significantly – from the gentle lighting of a gallery to the bright, consistent illumination needed in a workspace.
Candela Distribution (Candelas)
Candela, meanwhile, measures light intensity in a specific direction. This concept is vital in understanding how focused or diffused light is from a particular fixture. It influences whether a light source is suitable for ambient lighting, task lighting, or accent lighting, based on how it directs light within a space.
Color Rendering Index (CRI)
The Color Rendering Index is a scale from 0 to 100 that rates how accurately a light source displays colors in comparison to natural light. A high CRI is particularly important in environments where color distinction is important, such as in art studios or retail stores where the true color of objects is paramount.
Color Temperature (Kelvin)
Color temperature describes the color appearance of the light source and is measured in Kelvin. This aspect of lighting design is influential in setting the mood and ambiance of a space. Warmer lights, with lower Kelvin numbers, create a cozy and welcoming atmosphere, while cooler lights, with higher Kelvin values, are more energizing and conducive to concentration.
Efficacy (Lumens per Watt)
Efficacy is the measure of how well a light source converts energy into light. It's expressed in lumens per watt and is a crucial factor in evaluating energy efficiency. In a world increasingly focused on sustainability, understanding and choosing fixtures with high efficacy ratings can lead to significant energy savings and reduced environmental impact.
Lifetime (Rated Life)
The expected operational lifespan of a lighting fixture, typically expressed in hours, indicates how long you can expect the fixture to function before it requires replacement. This knowledge is essential for planning maintenance schedules and understanding the long-term value of your lighting investment.
Glare Rating
Finally, the glare rating is an important but often overlooked aspect. It measures the potential of a light source to cause discomfort to the eyes. In environments like offices, classrooms, or healthcare facilities, where people spend long hours, minimizing glare is crucial for comfort and productivity.
By familiarizing yourself with these key concepts, you set a solid foundation for diving into the specifics of a photometric report. This understanding enables you to make informed decisions, ensuring that your lighting solutions are not only aesthetically pleasing but also functionally appropriate and energy-efficient.
Step 2: Start with the Summary Sheet - Navigating the Overview of Photometric Reports
When you first open a photometric report, the summary sheet, or the cover sheet, is your initial point of contact. It's here that you get your first glimpse into the light fixture's capabilities, presented in a format that's designed to be immediately informative and accessible. The purpose is to provide you with essential information at a glance, making it easier to grasp the fixture's performance without delving into the more intricate details right away.
One of the first things to note on this sheet is the lumens, or the total light output. This figure is a quick indicator of the fixture's brightness and is pivotal in evaluating whether it suits the needs of your project. Next to the lumens, you'll typically find the wattage, which tells you about the fixture's power consumption. This is particularly important in the context of energy efficiency and sustainability goals.
The efficacy of the fixture, measured in lumens per watt, is another key figure to assess. It tells you how efficiently the fixture converts electrical power into light, an essential factor in both reducing energy costs and environmental impact. Alongside these figures, the Color Rendering Index (CRI) rating is often listed, providing insight into how accurately the fixture will display colors, which is vital in settings where color distinction is key.
The color temperature, measured in Kelvin, is also noted, affecting the mood and ambiance of the space. Whether you’re aiming for a warm, inviting atmosphere or a cooler, more focus-oriented environment, this figure will guide your decision.
Further details like beam angle, life expectancy, and dimmability can often be found on the summary sheet. The beam angle gives you a preliminary idea of how the light is distributed, whether it's a focused beam for spotlighting or a broader spread for general illumination. The life expectancy of the fixture informs your planning regarding replacement and maintenance. If dimmability is a feature, it's usually highlighted here, offering flexibility in lighting design.
Also, keep an eye out for energy efficiency ratings and certifications, such as ENERGY STAR, which indicate compliance with environmental and energy-saving standards. Sometimes, you'll even find estimates of operating costs, which can be incredibly useful for long-term budgeting and planning.
The visual elements, like graphs and diagrams, play a crucial role in giving a quick insight into the light distribution and output characteristics. Photometric curves, if included, can offer a snapshot of how light disperses from the fixture, providing a visual complement to the numerical data.
Lastly, it’s worth examining any supplementary information provided by the manufacturer. These notes can offer additional context or specific details about the fixture's performance or recommended applications. Comparative data, if available, is an invaluable resource, helping you understand the fixture's performance relative to industry standards or similar products on the market.
By thoroughly reviewing the summary sheet, you equip yourself with a foundational understanding of the fixture's performance. This knowledge is instrumental as you proceed to the more detailed analysis in the subsequent sections of the report, where specific aspects of the light's performance are examined in depth.
Step 3: Analyzing Luminous Flux in Photometric Reports
Moving deeper into the realm of photometric reports, the next crucial step is to analyze luminous flux. This aspect of the report provides a clear picture of the light output of the fixture, a fundamental parameter in any lighting design.
Understanding Luminous Flux
Luminous flux, measured in lumens, is essentially the total light emitted by a source. It's the first real measure of how bright a fixture is going to be in your space. But understanding luminous flux isn't just about acknowledging a number; it's about contextualizing this brightness within the needs of your specific project. For example, a large, airy lobby might require a fixture with a high lumen output to fill the space adequately, while a small study might need much less.
Matching Lumens with Project Requirements
The next step is to compare the lumens indicated in the report with the requirements of the intended environment. This comparison is not always straightforward – more lumens doesn't necessarily equate to better suitability. It’s about finding that sweet spot where the amount of light is just right for the space's purpose. An excessively bright light in a small room can be as ineffective as a dim light in a large hall.
Considering the Nature of the Space
The nature and use of the space play a significant role in this decision. In a residential setting, for instance, you might be looking for a softer, more ambient light, whereas in a commercial or industrial setting, the priority might be on clear, bright light that ensures safety and functionality.
Balancing Brightness with Comfort
Another key factor in analyzing luminous flux is the comfort of the occupants. Brightness levels should align with the activities performed in the space. In a setting like a classroom or an office, where people spend significant time, the light should be bright enough for clarity but not so intense that it causes discomfort or glare.
Energy Efficiency Considerations
Finally, in today’s energy-conscious world, it’s important to balance the need for brightness with energy efficiency. This is where the efficacy of the lighting (lumens per watt) comes into play. An energy-efficient fixture that provides adequate lumens while consuming less power is the ideal choice for most projects. It’s not just about the immediate impact on brightness but also about long-term energy usage and costs.
In summary, analyzing luminous flux is a critical step in interpreting photometric reports. It requires a balance between understanding the raw data provided by the report and applying this knowledge to the specific needs of your project. By carefully considering how the lumens align with the space requirements, nature of the environment, occupant comfort, and energy efficiency, you can make informed decisions that lead to effective, efficient, and pleasing lighting solutions.
Step 4: Deciphering Candela Distribution Plots in Photometric Reports
As we delve deeper into the world of photometric reports, Step 4 brings us to the intricate yet fascinating realm of candela distribution plots. These plots are not just graphs; they are the storytellers of how light behaves, how it travels, and how it interacts with its surroundings.
The Art of Reading Candela Distribution Plots
Imagine a candela distribution plot as a map, one that shows the intensity of light in various directions from the source. These plots are often circular or polar in form, resembling a spider's web, where each line and curve narrates a different aspect of the light's journey. The beauty of these plots lies in their ability to visually represent the light spread, offering insights into whether the light is narrowly focused, widely dispersed, or something in between.
Translating Plots to Practicality
To translate these plots into practical terms, consider the nature of your project. For instance, a narrow beam of light, indicated by a tight cluster on the plot, might be ideal for highlighting a piece of art or an architectural detail. Conversely, a broader distribution, shown by a more expansive spread on the plot, would be better suited for general area lighting in a lobby or a hallway.
Step 5: Assessing Illuminance with Foot-Candle Charts in Photometric Reports
Step 5 in our journey through photometric reports brings us to the practical yet nuanced world of illuminance, typically measured in foot-candles. This step is akin to translating the poetic language of light into the more pragmatic language of how much light is needed and where.
Grasping the Concept of Foot-Candles
Foot-candles measure how much light actually reaches a surface, which is different from how much light a fixture emits (lumens). It’s a bit like measuring rainfall: It’s not just about how much rain falls from the sky, but how much actually soaks into the ground. Similarly, foot-candles tell us how much of the emitted light illuminates the area we want.
Reading Foot-Candle Charts
Foot-candle charts in photometric reports usually resemble a grid or map, indicating the light levels across a given area. Each point on the chart corresponds to the illuminance level at that specific location. It’s a bit like looking at a topographical map, where instead of hills and valleys, you see the highs and lows of light levels.
- Highs and Lows: Areas with high foot-candle values are brightly lit, while lower values indicate dimmer areas.
- Uniformity: The goal often is not just brightness but uniformity. You want to avoid a patchwork of bright and dim spots, striving for a consistent illumination level that suits the task at hand.
Practical Usage in Design
In practical terms, foot-candle charts are invaluable for planning fixture placement and quantity. By understanding the distribution of light across an area, you can determine how many fixtures are needed and where they should be placed to achieve the desired illuminance level.
- Strategic Placement: For instance, in a library, you might place fixtures with higher foot-candle output over reading areas and lower output in shelving areas.
- Efficiency and Sustainability: This step also ties into energy efficiency. By optimizing the number and placement of fixtures based on illuminance needs, you can reduce energy consumption and costs.
Step 6: Evaluating Color Characteristics in Photometric Reports
As we venture further into the intricacies of photometric reports, Step 6 invites us to explore the captivating world of color characteristics - a world where light not only illuminates but also paints and defines the environment. This step is about understanding how the color properties of light influence our perception and interaction with spaces.
The Essence of Color Rendering Index (CRI)
Color Rendering Index, or CRI, is a metric that tells us how accurately a light source reveals the true colors of objects compared to natural daylight. Imagine walking through an art gallery; the vibrancy and authenticity of the artwork's colors are crucial to the experience. A high CRI light source ensures that the colors are vivid and true to life, making them pop and resonate with the viewer. In spaces like retail stores or design studios, where color differentiation is key, a high CRI can be the difference between a sale and a missed opportunity.
The Role of Color Temperature
Color temperature, measured in Kelvin, is another facet of light that dramatically affects the ambiance of a space. It's like the light's color palette, ranging from warm yellows and reds to cool blues and whites. A warm light, on the lower end of the Kelvin scale, creates a cozy and inviting atmosphere, perfect for a relaxing café or a living room. On the other hand, a cooler, higher Kelvin light is energizing and alert, ideal for an office or a classroom where focus and clarity are essential.
Integrating CRI and Color Temperature in Design
Evaluating and integrating these color characteristics into lighting design is a dance between science and art. It involves:
- Analyzing the Use of Space: Understanding the activities and mood desired in a space is key. A high CRI light might be essential in a graphic design studio but less so in a storage room.
- Balancing Aesthetics and Functionality: The choice of color temperature should complement the interior design and furniture, creating a cohesive and visually pleasing environment.
- Considering Human Interaction: The way people feel and behave in a space is greatly influenced by light. A well-chosen color temperature can enhance comfort, productivity, and even well-being.
Step 7: Utilizing Illuminance Maps in Photometric Reports
As we embark on Step 7 in our journey through photometric reports, we enter the realm of illuminance maps - a facet of lighting design that combines technical precision with the artistry of illumination. Illuminance maps are not merely charts or diagrams; they are a canvas where light plays the lead role in creating an environment that's both functional and aesthetically pleasing.
The Blueprint of Light Distribution
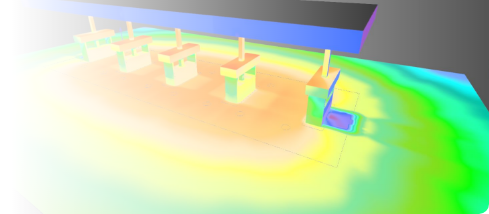
Illuminance maps can be seen as the blueprints of how light will interact within a space. These maps, often detailed and precise, show how light from a fixture falls and distributes across an area. Imagine them as a bird's-eye view of a room, with varying shades indicating different levels of light. These shades tell a story of brightness and shadow, of focus and ambiance.
Deciphering the Light Landscape
Reading an illuminance map is like deciphering a landscape of light. The maps usually display varying degrees of light intensity across a given area, with darker areas indicating lower light levels and brighter areas signifying higher intensity. This visualization helps in understanding which parts of a room will be well-lit and which might remain in relative shadow.
- Identifying Hotspots and Dark Spots: The goal is often to achieve a balanced light distribution. By studying the map, you can identify areas that might be overly bright (hotspots) or inadequately lit (dark spots).
- Strategic Fixture Placement: The maps serve as a guide for placing light fixtures strategically, ensuring that each area of the room receives the appropriate amount of light.
Step 8: Considering the Environment and Usage in Photometric Reports
In Step 8 of deciphering photometric reports, we shift our focus to a broader, yet equally crucial perspective: considering the environment and usage for which the lighting is intended. This step transcends the specifics of lumens and foot-candles, inviting us to contemplate how the light interacts with its surroundings and serves its intended purpose.
Indoor vs. Outdoor: Adapting to Environments
The distinction between indoor and outdoor lighting is significant, each with its unique challenges and requirements.
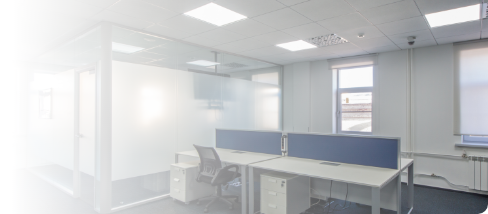
- Indoor Lighting: Here, the focus is often on creating a comfortable, visually appealing environment that aligns with the interior design. It’s about choosing lighting that enhances the space's aesthetics while providing adequate illumination for tasks and activities.
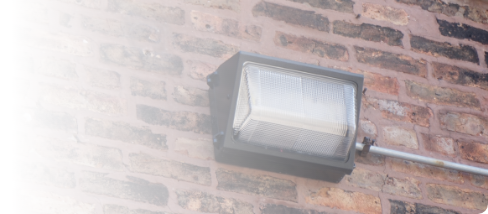
- Outdoor Lighting: Outdoor fixtures need to be robust, weather-resistant, and often more powerful. The lighting should ensure safety and navigation, such as illuminating walkways or highlighting architectural features, while being mindful of issues like light pollution and energy efficiency.
Understanding Specific Needs
Each space has its unique lighting needs, influenced by its function, the activities performed within it, and the people who use it.
- Commercial Spaces: In areas like offices or retail stores, lighting should not only be functional but also contribute to an inviting atmosphere that encourages productivity or shopping.
- Residential Areas: Home lighting requires a balance of comfort, functionality, and style, adapting to the diverse needs of living spaces, kitchens, bedrooms, and more.
- Specialized Environments: Settings like art galleries, hospitals, or industrial sites demand specific lighting solutions tailored to their unique requirements.
Integrating Lighting with Smart Systems
In today’s technologically advanced world, the integration of lighting with smart systems is becoming increasingly important.
- Automated Controls: Features like motion sensors, dimmers, and timers can enhance the functionality and energy efficiency of lighting systems.
- Smart Home Ecosystems: In residential settings, the ability to integrate lighting with home automation systems for centralized control is a growing trend.
Conclusion: Harnessing the Power of Light with Photometric Reports
In conclusion, navigating through photometric reports is an enlightening journey that blends technical acumen with creative vision. Each step, from understanding basic lighting principles to consulting with experts, is crucial in transforming spaces through thoughtful lighting design. These reports are not just data compilations; they are essential tools that guide us in crafting functional, aesthetically pleasing, and efficient lighting solutions. They help us understand the language of light and use it to enhance the experience of every space, whether it's a cozy home, a bustling office, or a vibrant retail environment. This journey is a powerful testament to the transformative impact of well-executed lighting, turning ordinary spaces into extraordinary experiences.

